Motion Terms
Speed

Average Speed - how much distance an object covers per unit time
Sheldon from the Big Bang explains physics
Why is Science Important? from Alom Shaha on Vimeo.
Unit I - Mechanics
Study of the relationship between force and motion

I. Kinematics
Mathematical methods of describing and predicting motion
Describe motion by using:
A) Average Speed
Average Speed of 120 miles per hour can also be written ... 120 miles/hour
per = divided by
Could mean travelled 120 miles in one hour, OR ... 60 miles in 1/2 hour (30 minutes), OR 15 miles in 7.5 minutes.
Avg. Speed - how much distance an object covers per unit time
1) Units: m/s, km/hour, miles/hour
Average Speed = Δd/Δt
Distance


(meter ≈ 1 yard)
(km ≈ .6 miles)
Time

seconds, minutes, hours
Ex 1
An object travels 5 meters in 2 seconds.
Find: its speed.
Ex 2
An object moves at a rate of 3 m/s for 1.5 seconds.
Find: how far did the object move?

Ex 3
An object moves at a rate of 4 m/s over a distance of 10 meters.
Find: how long did it take to travel that distance?
B) Motion Plots
(a.k.a. Motion Diagrams)

Position vs. Time Plot
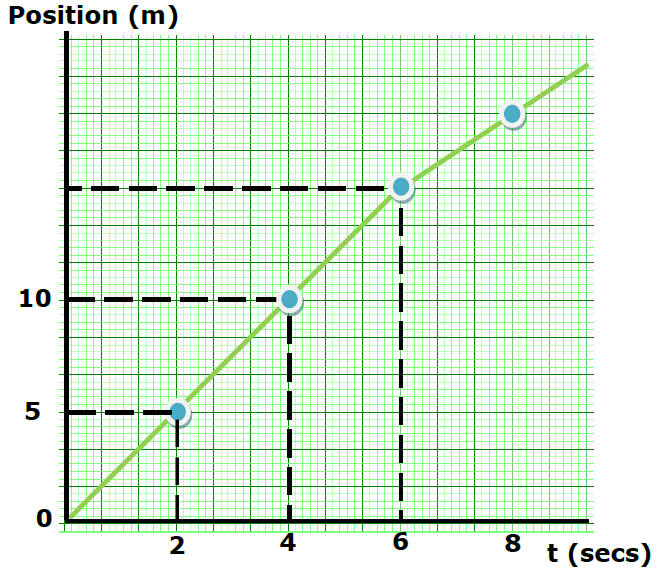
Speed from 0 to 2 seconds?
Speed from 2 to 4 seconds?
Speed from 4 to 6 seconds?
Does the object travel faster or slower from 6 to 8 seconds?
Compare speed from 6 to 8 sec with speed from 8 to 9 sec.
What kind of motion produced this plot?
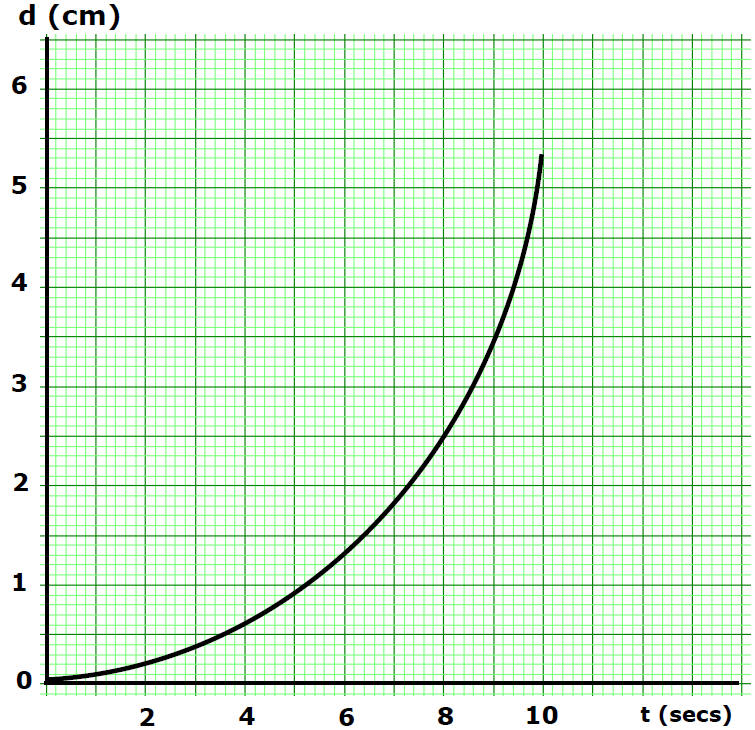
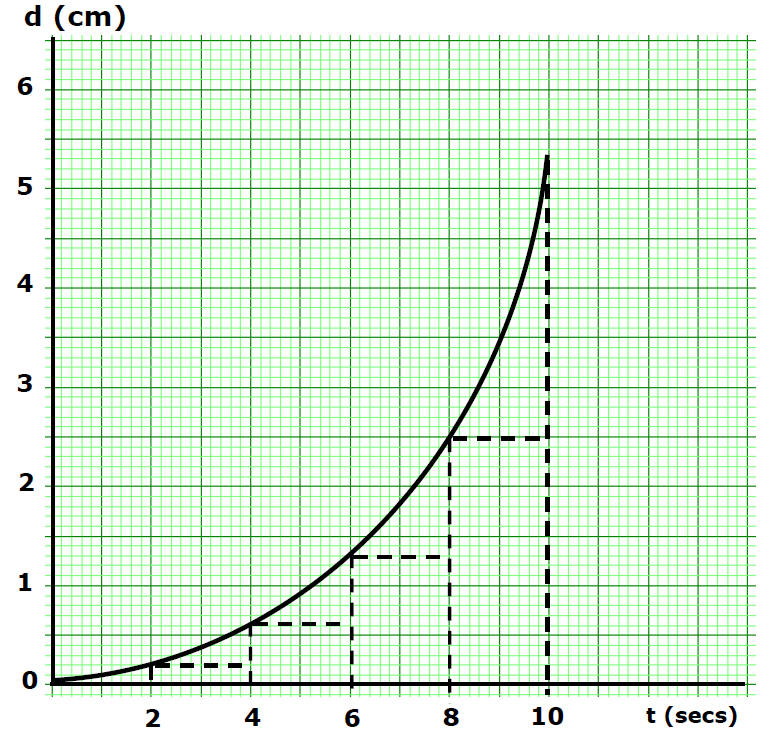

Equations
Speed


Velocity (speed and direction)

Direction
Sprint Timing Gates
A track coach set up timing gates along a straight track to study a runner’s training sprint. The runner’s distance from the starting line was recorded every 2.0 seconds, as shown in Table 1.
Table 1: Runner Position Data
| Time (s) | 0 | 2.0 | 4.0 | 6.0 | 8.0 | 10.0 |
|---|---|---|---|---|---|---|
| Distance (m) | 0 | 8.0 | 16.0 | 24.0 | 36.0 | 48.0 |
Which statement best describes the runner’s motion based on the data?
▶ Want a challenge? Open 6 more Regents-style questions (harder · mixed formats)
Challenge score: 0 / 6
C1. Which graph best represents distance versus time for the runner?
C2. Substitute numerical values into a mathematical representation that can be used to determine the runner’s average speed for the entire 10.0 seconds. Then calculate the average speed.
C3. A student makes the following claim.
Place a check mark in either the Support or Refute box. Justify your response using a mathematical relationship.
C4. If the runner keeps the same speed she had from 6.0 s to 10.0 s, determine the time at which she crosses the 100.-meter mark.
C5. A second runner’s distance–time line is parallel to the first runner’s line from 0 to 6.0 s but starts at 10 m instead of 0 m. Which conclusion is correct for that interval?
C6. Table 1 seems to show the runner changing speed suddenly at exactly 6.0 s, but a real runner must speed up over some time. Describe one change to the coach’s data collection that would give better evidence of how the runner’s speed actually changed, and explain why it would help.